

God, grant me the serenity to accept the things I cannot change,
courage to change the things I can,
and wisdom to know the difference.
At Button we run a SaaS platform. It's a distributed system, and like most distributed systems it's almost always experiencing some sort of failure. Offering a reliable product in spite of this requires knowing when and where failures occur so we can build resiliency around them.
This isn't always easy. Even with a centralized view of all those failures, sense has to be made of them. Are those HTTP timeouts okay or suggestive of a burgeoning outage? Are they drowning out a critical null pointer dereference? Is a lack of errors a good sign or cause for concern (because the monitoring system is down)?
There's lots of signal and lots of noise, and we need help to know the difference. For us, that help arrived in the form of a simple model and some tooling tweaks. With confidence and calm, we're alerted to the things we can can change and accept the things we cannot.
The bedrock of our approach is a basic taxonomy. Errors are generally one of two types, each of which we need to understand quite differently:
Conflating these two types in an error handling scheme will likely cause a good deal of frustration, since they have distinct causes and distinct remedies. Deterministic errors reveal an honest mistake or invalid assumption on behalf of the programmer. They can be corrected by updating the software. Transient errors are a fact of life: the network and its associates are just unreliable. They are problematic only in aggregate (e.g., if >= 1% of network requests are failing), and actionable only in that they can likely be tuned (increase that timeout) or avoided (drain that data center).
Handled separately, the way forward is a bit clearer. We need a precision tool for surfacing deterministic errors with enough supporting context to make a fix obvious. Every time that tool shows up with a new error, we need to triage and prep a fix with urgency. Then, we need an aggregate tool to track the rate of transient errors of a given type. Every time that tool reports a rate crossing some healthy threshold, we similarly need to triage and evaluate.
Somewhere, somehow, we'll have to make a determination when a failure occurs: was it transient or not? In our programming environment of choice, that might look something like this:
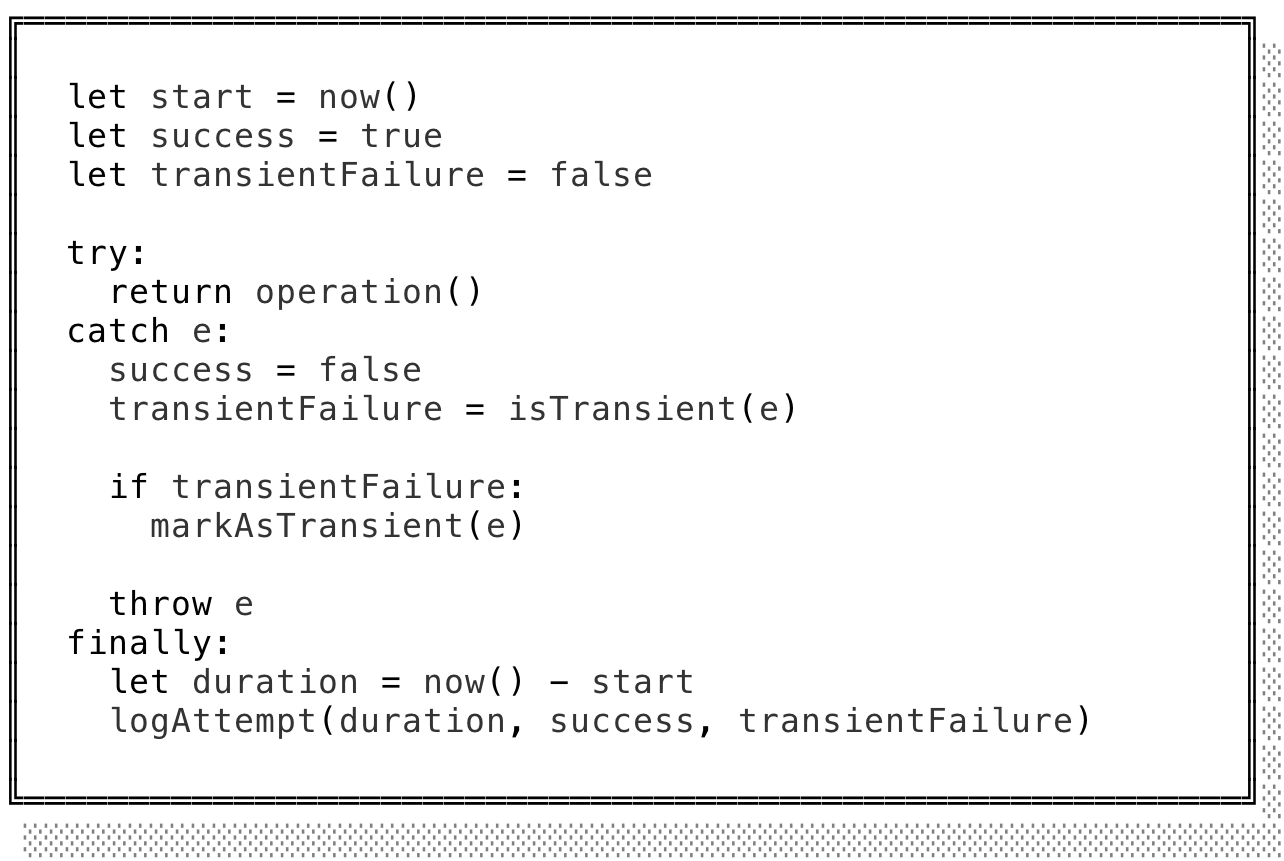
Tedious though it would be to repeat this ceremony over and over again every time we invoked a spurious operation, we are software engineers and abstraction is our game. Bundled within a function, this boilerplate only needs to be parameterized by a few values depending on its context:
Elided in the code snippet above for brevity, a couple other descriptive parameters will go a long way in distinguishing different classes of transient failures in our tooling:
Despite getting some of the boilerplate out of the way, all of this might still seem a bit tedious: every time we make a make an rpc call we need to specify isTransient, target, and action? Well, no: we can again reach for abstraction.
It's never a bad idea as a company to have a standard library of sorts, specific to the needs of your team. Such a library is a suitable home for a general purpose "rpc call" module that can conveniently package all this (and more!) behind an interface that asks little more of the typical developer. isTransient can assume a default implementation appropriate to most rpc calls, target is implicit to the interface, and since a developer will likely need to specify the hostname, method, and pathname of an http request anyways, they get action for free. The same trick can be applied to any other operation; most folks will never need to sweat all this instrumentation and categorization happening behind-the-scenes.
Still unresolved however is with what tools we route and track our two failure types. Unmistakably, the least important aspect of this scheme is what specific tools we use — many will do admirably — but to complete the illustration we'll reach for Sentry and Prometheus.
Sentry is an excellent precision tool for recording our deterministic failures. Errors are typically reported with fully hydrated stack traces, then coherently grouped together under an "Issue" complete with all the accessories you'd expect (histograms, summary statistics, …). Triaging, discussing, and ultimately resolving Issues is as seamless as you'd hope, and Sentry is happy to dispatch alerts via whatever channel a team prefers.
To route deterministic failures into Sentry, we place a catch-all error handler high in our application's callstack. Since errors that bubble up to it will have already been evaluated as deterministic or transient (and marked accordingly), we can most simply forward the deterministic ones to Sentry and discard the transient ones.
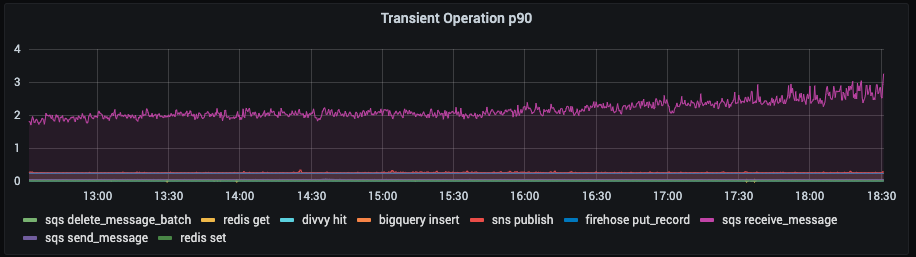
Prometheus meanwhile is an excellent aggregate tool for recording all attempts of an operation that can fail transiently. It centers around the notion of a metric: any number that can be observed to change over time. Metrics can have labels associated with them, which is a convenient way to indicate, for a given operation, whether it succeeded or failed, was transient or not, and which target/action it was for. There's plenty more to say on this topic, but for our purposes it means we can easily derive charts like this, that show the 90th percentile duration of all operations, grouped by target and action:
This may seem like a lot of data to exfiltrate for every operation an application might need to invoke. Fortunately, Prometheus operates by polling applications for their metrics on a fixed sampling interval. All that's required of an application is to update some bit of in-process state when an operation is attempted, then expose that state over a well-known HTTP route. We've never feared instrumenting even the most performance-critical applications this way.
Alerting is as simple as we described earlier — we can set a threshold failure rate over which we wish to be paged to investigate. If our threshold was set at 0.01% per target, then the following metric would have paged us shortly after 14:00:
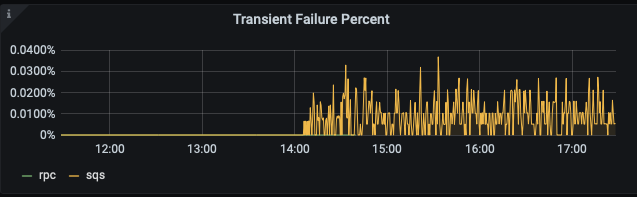
Undoubtedly such subtle shifts in failure rates are hard to detect without the right tooling. With it, big changes in system performance leap off the page.
With good system coverage of this scheme, it's reasonable and safe to expect a few dramatic outcomes.
First, expect to spend way less time sifting through logs or idly wondering if something is breaking without your knowing. You'll be alerted early when the characteristics of your system change for the worse. When they do, you'll have excellent supporting information to guide your investigation. But — you won't be paged when the odd HTTP request times out while things are otherwise healthy.
Second, despite the overhead of the scheme, expect your engineering team to spend less time dithering about how to handle error conditions while they're making routine updates. This scheme does the heavy lifting for them. In almost all cases, folks will just want to use the standard library abstractions provided and let any errors bubble up to the catch-all handler.
Finally, expect your customers to see a higher quality of service. Measuring something is the first step towards optimizing it.
Special thanks to Chris Maddern and Adam Berger for reviewing drafts of this post.

.png)
.png)
